Budgeting for Tomorrow’s Economy
How Colorado municipalities are navigating economic uncertainty
and serving their constituents
By Maeve McHugh, municipal research analyst
The 2026 State of our Cities and Towns survey administered from August to October 2025 examined municipal budgeting during a time of increased economic uncertainty. Respondents answered questions regarding general revenue trends, state and federal funding expectations, budgeting and financial planning, and how local governments are adapting to challenges.
Overall, Colorado municipalities are grappling with uncertainty across their economies. In the face of conservative revenue projections and mandated expenditures, local governments consider increasing fees, postponing projects, reassessing employee benefits, and more. Unfunded street and road maintenance and improvements are the top concern for municipalities going into 2026, a departure from affordable housing challenges over the last couple of years. It seems that local economies continue to settle post-COVID, as federal funds taper and inflationary pressures take their toll.
Uncertainty around current economic conditions are forcing cities and towns to make difficult decisions. They will need to be flexible in decision-making in order to adapt to new realities, highlighting the importance of CML’s work in addressing state preemption and championing local control.
Responding municipalities
Of CML’s 271 member municipalities, 108 responded to the survey for a 40% response rate. Respondents represent municipalities of all sizes and geographic areas of our state; 32% of municipalities with populations less than 2,000 people, 45% of municipalities with populations between 2,000 and 24,999, and 68% of municipalities with populations of 25,000 people or more. Responses slightly overrepresent large municipalities relative to their share of CML membership, while mid-sized municipalities were accurately represented, and small municipalities were slightly underrepresented.
A municipality’s size and geography are two important factors in considering how their economy is structured, key revenue sources, what financial challenges they face, and the reasons behind these challenges. When possible, this report will distinguish how responses differ based on population size and geography.
General municipal revenue
For 18 years, the State of our Cities and Towns survey has asked municipalities whether they feel their economy is better or worse than the year prior. In the 2010s, overall municipal feelings about the economy tended to be better than those up to this point in the 2020s.
When asked about overall feelings about the economy in 2025 compared to 2024, nearly half of responding municipalities indicated that they feel it is the same, while just over one third of municipalities reported that their overall economy was somewhat or much worse this year compared to last.
Large municipalities were more likely to report a worsening outlook, whereas medium and small municipalities more commonly indicated they felt the economy was about the same as last year. Western Slope and Mountain communities were more likely to report feeling better about their economies this year.
Data about revenues were mixed, varying by municipality size and location. These data roughly mirror that of economic outlooks. Nearly half (48%) of respondents indicated their revenue was about the same in 2025 compared to 2024, while 26% of respondents felt it was somewhat or much better, while an equal share indicated feelings of somewhat or much worse revenues.
Small and mid-sized municipalities were generally more likely than large municipalities to feel their revenue is better in 2025 than in 2024, though more in this group felt their revenue was about the same than felt it was better. Meanwhile, 42% of large municipalities felt their revenue was somewhat worse.
Taking geography into account, Western Slope and Mountain communities declared a more positive outlook, representing a greater share of much or somewhat better municipal revenue in 2025. Meanwhile, Eastern Plains and Front Range municipalities were more likely to report revenues to be about the same and were more likely to have somewhat or much worse municipal revenue in 2025.
Considering changes in municipal revenue, over 40% of municipalities reported increases in sales, use, and excise taxes and/or property taxes. Of the survey’s respondents, municipalities with populations under 2,000 were least likely to report increases in revenues from sales, use, and excise taxes. Conversely, the greatest reported decrease in revenues is attributed to loss of state funding. The median decrease in state funding to municipalities was 15%, with some reporting 100% decreases in state funding, a critical source of funding for small communities. As one Eastern Plains municipality commented, “the drop in available state grant funds, HUTF, and severance are a big impact to a small budget”.
While this data indicates that certain revenue sources are increasing, qualitative data and commentary from respondents indicate that the rising cost of service delivery tends to outpace revenue gains. Qualitative data also indicates that changes in state funding have further burdened municipalities by reducing their share of funds, generating uncertainty as cities and towns plan their budgets.
For the first time since 2021, lack of affordable housing was not the most reported challenge for municipalities. Unfunded street and road maintenance and improvements was identified as the most common challenge municipalities are facing, followed closely by lack of affordable housing, increased health and liability insurance costs, and state-mandated expenditures.

The intensity of these challenges varies depending on municipality, size, and region. Affordable housing was a more common concern in Western Slope and Mountain communities, while state-mandated expenses and increased liability insurance costs were more prevalent on the Eastern Plains. Large municipalities reported slow growth in tax revenues to be the biggest challenge in 2026, while medium sized communities struggle with increased health insurance costs, and small municipalities wrestle state-mandated expenditures and unfunded water infrastructure improvements.
Municipal Spotlight:
Hayden, Idaho Springs, and Parker
Insurance Increases
Members identified liability and health insurance increases as major contributors to their rising costs. The cost of health insurance is increasing for millions of Americans across industries, which reflects the rising cost of care in general. However, increases for Hayden, Idaho Springs, and Parker, went from steady single digit to double digit increases this year. In order to keep their budgets balanced, some municipalities are considering reducing benefits, increasing deductibles, or shifting some costs onto employees. This makes recruiting and retention of high-quality municipal employees difficult, especially for smaller municipalities with more limited resources.
Liability insurance is another source of quickly rising expenses for municipalities. Interviewed municipalities indicated that they are satisfied with their providers, but that it is simply the reality of the market. Natural disasters like fires, floods, and hail contribute to rising risk for insurance pools, and the burden is felt across the property insurance market, especially with uncertainty surrounding changes to FEMA assistance.
Another category of liability insurance that is proving burdensome to municipal budgets is excess liability insurance for law enforcement. One municipality interviewed indicated that their liability insurance was 20% of the police department’s budget and attributed this increase to growing scrutiny and associated increases in liability. CML’s 2024 State of our Cities and Towns report highlighted the rising costs of liability insurance. In that survey, respondents identified law enforcement lawsuits as the most common type of litigation filed against them.
Although insurance costs are rising across the board, one thing the interviewed municipalities have in common is that they agree things could be worse.
State and federal funding
Of the responding municipalities, 87% reported seeking state funding in at least one area since January 2024. The average funding success rate for all project types reported was 71%. The most common area for which municipalities sought state funding in the last two years was water, wastewater, and stormwater projects, an area where Eastern Plains communities pursued funding at a higher rate. In general, large municipalities were more likely to seek state funding for projects, with law enforcement being the most common type of funding support pursued by larger municipalities.
Since January 2024, federal funding was pursued at a much lower rate than state funding. The difference in state and federal funding sought is due to the different types of funding available at the federal level, and that federal funds are often distributed by the state. Of the types of projects that sought federal funding, two of the three most common categories included road infrastructure and maintenance (35%) and pedestrian or cyclist safety (34%), with water infrastructure ranking highly again (34%). The award rate for federal funding was generally lower than it was for state funding at 54%.
About one in six municipalities canceled a project or service due to reductions in state and federal funding. This tracks national trends, where municipalities are adjusting their budgets as federal COVID-19 relief funds wind down or are canceled. While the survey included questions to understand state and federal grants not awarded, it did not account for projects that were not pursued at all due to capacity restraints and concerns over securing state or federal funding.
Not surprisingly, large-scale infrastructure investments such as water and wastewater projects and road construction and maintenance projects were overwhelmingly identified as the most important areas for which Colorado municipalities receive state funding. Eastern Plains communities and Western Slope and Mountain towns viewed water as the most important area in which they receive state funding, while the Front Range declared road construction or maintenance as the most important area for state funding.
Budgeting and planning process
The budgeting process has largely remained the same for municipalities this year. Only 14% of municipalities indicated they made significant changes to their budgeting processes this year. In their comments, respondents most often attributed new staff and management as the reasons for initiating new practices. Other respondents noted the need to reevaluate projects amid economic uncertainty, particularly slowing revenues and rising costs.
When it came to determining their municipal budget, 65% of responding municipalities reported that the budgeting process was a little more or much more challenging this year.
The top sources of challenges this year are economic uncertainty and expected increases in salary and benefits costs, which accounted for the largest share of municipalities indicating it as a significant challenge. These challenges were followed by expected inflation, unexpected expenses, and reduction in local revenues, outlining the challenges municipalities are facing when it comes to keeping up with rising costs.
Municipal Spotlight:
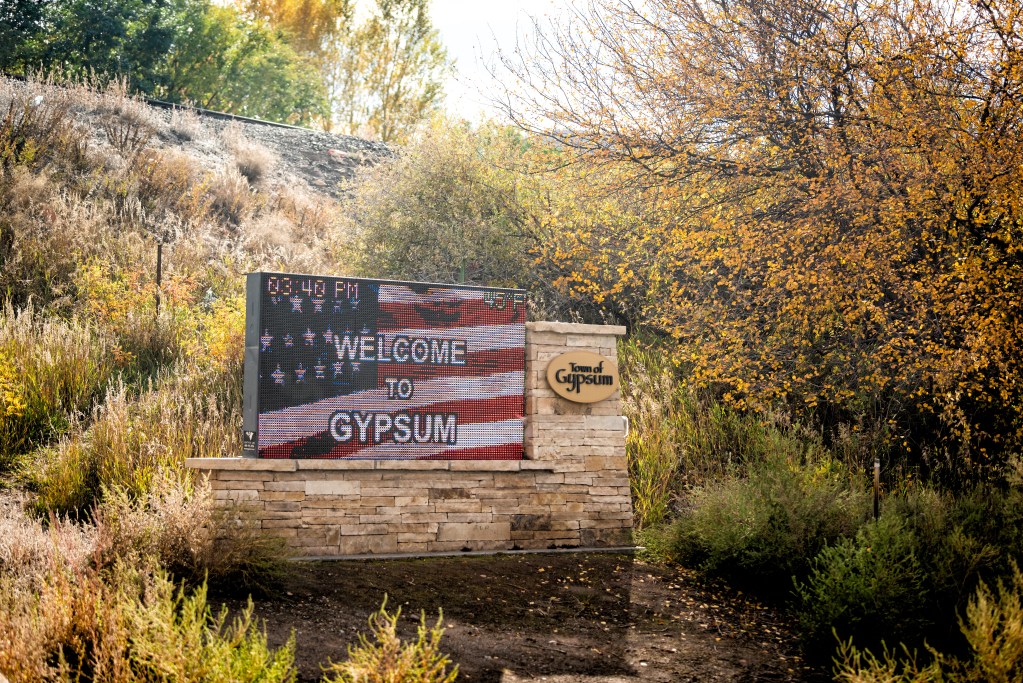
Dolores and Gypsum
Policing without a police department
Partnerships with county sheriff’s departments can be an effective way for communities to save both time and money. For smaller municipalities with limited resources to fund their own police departments, contracting with the county sheriff’s office is often the practical choice. Gypsum and Dolores indicated in their survey responses that a partnership with the county has been the easier financial approach, as establishing a municipal police force is too costly and beyond their capacities.
In both of these communities, these contracts have been in place for decades. County sheriff’s departments are able to leverage greater resources for capital spending and have the capacity to respond to issues as they arise. Respondents also indicated that relationships with deputies have been positive, especially when deputies are consistently assigned and have the opportunity to build connections and ties to the community.
Municipal leaders emphasized the importance of clear and predictable contract terms, including defined service levels and mechanisms to address staffing or cost changes. Greater predictability in multi-year agreements was cited as critical for effective budget planning and reduced uncertainty during negotiations.
In recent years, these contracts have increased significantly. Survey responses from CML members indicate that these increases are driven by competitive salaries to attract and retain talent, higher liability insurance costs for law enforcement, and differences in administrative practices across counties. Officials also noted that workforce shortages affecting law enforcement agencies statewide influence both contract pricing and service delivery.
For leaders in Gypsum and Dolores, these trends have raised concerns about affordability and alignment between costs and services. Respondents cited instances of unclear or unmet deliverables and expressed concern that rising costs do not always align with financial capacity while acknowledging that these challenges reflect broader structural pressures rather than a decline in service quality. Together, these examples illustrate both the long-term value of municipal-sheriff partnerships and the growing importance of clear contracts, predictable cost structures, and shared expectations as fiscal pressures continue to affect local governments.
Additional challenges to creating this year’s budget:
“Budgeting for emergency response needs due to flooding, which we are expecting annually now”
– Eastern Plains community“Insurance costs (liability and health insurance) are really putting pressure on our budget”
– Western Slope/Mountain community“Law enforcement contract [with the county] has gone up significantly”
– Western Slope/Mountain community“Managing tariffs”
— Western Slope/Mountain community“A possible new development that would greatly increase a lot of items in our budget”
– Eastern Plains community“We are still recovering from a voter-approved reduction in sales tax on food for home consumption that went into effect in FY2024”
– Front Range community“Large increases in general liability, law enforcement and property insurance coverage”
– Front Range community“Uncertainty as to what the State Legislature will do in terms of mandates, TABOR, property taxes, and pet projects”
– Eastern Plains community
In comments provided by respondents, increasing costs was a common barrier to safeguarding their budgets into the future. Many noted that higher costs for service delivery, paired with flat or volatile revenue sources make unfunded mandates and offering competitive wages and benefits more difficult to navigate.
Barriers to saving money:
“Aging infrastructure, rising costs, and less state and federal funding”
– Western Slope/Mountain community“Competing priorities – immediate service needs, infrastructure demands, or community expectations often outweigh long-term savings. Rising costs – Inflation, labor agreements, and healthcare premiums”
– Front Range community“Cost of infrastructure maintenance, particularly roads. Keeping competitive wages to retain employees.”
–– Eastern Plains community“Increased cost of personnel expenses – revenues are not keeping up with costs, especially on the benefit side. Going to have to look at benefit reductions in the future although we are already behind on pay.”
– Western Slope/Mountain community“Increases in inflation, unfunded mandates, lack of consistency in direction from the Legislature and Executive Branch, unwillingness of the residents to increase taxes, economic uncertainty tied to interest rates, housing prices, inflation, etc.”
– Eastern Plains community“Infrastructure needs are critical. Deferred maintenance [needs] are outweighing new project needs and cannot be deferred any longer”
– Western Slope/Mountain community“It’s hard to save funds when you have too many present-day needs”
– Front Range community“The continued flattening and declining of major revenue sources of sales and use taxes (and other revenues tied to economic conditions) and property tax.”
– Front Range community
Municipal Spotlight:
Keystone
Keystone’s first budget
“As the budget process proceeded, it was incredibly rewarding to see the thought and care that the council put into their decisions.” – John Crone, Keystone Town Manager
Keystone, Colorado’s newest incorporated municipality, completed their first budget this year. For already established municipalities, the annual budget process follows certain steps, where finance officers and elected officials know what to anticipate in terms of financial trends and their community’s goals and priorities.
Keystone had the opportunity to build their budget from the ground up, and in the process remind us of a few important municipal budgeting principals along the way. Among the challenges faced by the town was uncertainty around revenues and expenditures. Their revenue data was limited to the 2% sales tax remitted by Summit County, and additional data from Keystone’s incorporation effort. Information on expenditures was fairly straightforward, as the town’s staff remains small but mighty, and many services are subcontracted, allowing these line items to remain broad. Additionally, as a brand new town, Keystone has yet to establish long-range plans, strategic goals, or other priorities to help shape the budget. The town was trying to budget for existing issues, while simultaneously trying to study the issues and determine their level of need.
While starting a budget almost from scratch is daunting, Keystone’s town council was meticulous in learning the process and coming up with solutions. The dedication of staff and council yielded a successful first budget. The town’s cautious and thoughtful approach will allow them not only to meet their needs, but to make investments in infrastructure and in ways they did not anticipate being able to do for several years.
Impacts and adaptation
In the face of uncertainty, nearly a quarter of municipalities with reserve funds will tap into them to meet their needs, with another quarter undecided at the time of their response.
To bolster their revenues, nearly two-thirds of respondents indicated that they would pursue new grants. The next most common method for increasing revenue is to modify or establish user fees, which are a widely used approach in Colorado where TABOR limits municipalities’ ability to levy and retain taxes to raise general revenue. Nearly 60% plan to increase existing fees, and 30% of municipalities plan to add new fees.
To adapt to changes in revenues in the face of economic uncertainty and worries about ever-increasing expenses, 56% of municipalities reported plans to make targeted or across the board cuts, while 44% indicated that they are not making cuts to their budgets.
Additional money-saving strategies include increasing partnerships with other local governments and contracting out services. Western Slope and Mountain communities are more likely to increase working in partnership with other local governments, while Front Range municipalities were more likely to incorporate technology and automation to provide services.
Municipal Spotlight:
Larkspur

Contracted Services
For small municipalities, hiring contractors to carry out certain services is essential to balancing their budgets. In Larkspur, contracted services include their water and sewer operators, information technology, engineering services, and landscaping city-owned property. In a smaller municipality like Larkspur with a full-time staff of six, it is not feasible to manage large scale infrastructure like water or street engineering.
Larkspur already subsidizes water fees for residents and hires locally for their landscaping needs. These contracts are critically important to Larkspur’s budgeting process. While the town will need to continue contracting for water, IT, and engineering services, staff are being creative with how they might shift landscaping operations in-house, without overburdening the two public works employees.
Automation is another strategy municipalities are considering to save money. As the artificial intelligence (AI) applications for local government are coming to light, less than 50% of municipalities reported using or having plans to use AI to provide services in 2026.
While many municipalities are looking to external solutions (partnerships with other local governments, nonprofits, and private entities, as well as contracting out and leveraging AI) they are also making operational adjustments to manage costs.
Nearly 65% of municipalities reported that they are currently considering, have plans to start, or are already delaying projects or programs to save money. Another 36% of respondents report plans to or are already deferring maintenance, with another 28% considering. Some are combining departments, where 22% of municipalities plan to or are already doing and another 6% are currently considering. Hiring freezes were less common, with 26% of municipalities at least considering it. Of those already implementing hiring freezes, 7% plan to discontinue, and 57% will continue.
Other ways in which municipalities are saving money:
“Cutting or reducing services such as maintaining parklands, reduction in snow removal, halting overtime pay, delaying projects for possible better times”
– Eastern Plains community“Energy performance savings, increasing insurance deductibles, reducing employer retirement match, reduction in professional development, eliminated some employee benefits, and reduction in services to community.”
– Front Range community“Pass a larger portion of healthcare to employees (we have historically absorbed increases) Compressed work week has resulted in lower overtime costs. Modifying PTO buyout to reduce expense and encourage employees to actually use their PTO.”
– Front Range community“Renegotiating contracts, switching vendors for subscription-based services that have lower prices, consolidating and streamlining software subscriptions with interchangeable functionality”
– Western Slope/Mountains community“Taking a more defensive, sustainable posture to infrastructure maintenance is key to maintaining services, landscaping and policing. Staying ahead of maintenance with technology and well-trained staffing. Eliminating as much staff turnover as possible and investing in their knowledge and professionalism. Grants have consistently created opportunities for rapid improvements in delivering our forecasted and planned developments.”
– Western Slope/Mountain community“We will reduce training, subscriptions, memberships, etc. We will not hire up to support succession planning. Adopting renewable energy to reduce long term facilities costs.”
– Eastern Plains community
Despite reported economic uncertainty, more municipalities indicated that they plan to increase or make no changes to budgets for departments and services. The most common planned increase is police department budgets, where 44% of municipalities project increases, and utilities with 41% reporting planned increases. To balance these increases, respondents commented that limiting capital and special projects and deferring maintenance would help to balance increases elsewhere in their budgets.
Despite challenges and unforeseen obstacles, 2026 will bring opportunities for Colorado municipalities to continue to strengthen their commitment to their communities. In step with our members, CML will rise to the occasion, seeking creative solutions to problems outlined in this report.
Appendix
Survey Instrument
Table of Respondents:
| Municipality | Colorado Region | Population Category | Population |
|---|---|---|---|
| City of Westminster | Front Range | 25,000 or more | 116,317 |
| City of Northglenn | Front Range | 25,000 or more | 38,131 |
| City of Thornton | Front Range | 25,000 or more | 141,867 |
| City of Brighton | Front Range | 25,000 or more | 40,083 |
| City of Centennial | Front Range | 25,000 or more | 108,418 |
| City of Englewood | Front Range | 25,000 or more | 33,659 |
| City of Sheridan | Front Range | 2,000 to 24,999 | 6,105 |
| City of Greenwood Village | Front Range | 2,000 to 24,999 | 15,691 |
| City of Aurora | Front Range | 25,000 or more | 386,261 |
| Town of Springfield | Eastern Plains | Less than 2,000 | 1,325 |
| Town of Pritchett | Eastern Plains | Less than 2,000 | 112 |
| Town of Campo | Eastern Plains | Less than 2,000 | 103 |
| City of Las Animas | Eastern Plains | 2,000 to 24,999 | 2,300 |
| City of Lafayette | Front Range | 25,000 or more | 30,411 |
| Town of Jamestown | Front Range | Less than 2,000 | 256 |
| Town of Lyons | Front Range | 2,000 to 24,999 | 2,209 |
| City of Boulder | Front Range | 25,000 or more | 108,250 |
| City of Longmont | Front Range | 25,000 or more | 98,885 |
| City and County of Broomfield | Front Range | 25,000 or more | 74,112 |
| City of Salida | Western Slope / Mountains | 2,000 to 24,999 | 5,666 |
| Town of Cheyenne Wells | Eastern Plains | Less than 2,000 | 758 |
| City of Idaho Springs | Front Range | Less than 2,000 | 1,782 |
| Town of Silver Plume | Western Slope / Mountains | Less than 2,000 | 207 |
| Town of San Luis | Western Slope / Mountains | Less than 2,000 | 598 |
| Town of Sugar City | Eastern Plains | Less than 2,000 | 259 |
| Town of Cedaredge | Western Slope / Mountains | 2,000 to 24,999 | 2,279 |
| Town of Hotchkiss | Western Slope / Mountains | Less than 2,000 | 875 |
| City of Lone Tree | Front Range | 2,000 to 24,999 | 14,253 |
| Town of Larkspur | Front Range | Less than 2,000 | 206 |
| Town of Castle Rock | Front Range | 25,000 or more | 73,158 |
| Town of Parker | Front Range | 25,000 or more | 58,512 |
| City of Castle Pines | Front Range | 2,000 to 24,999 | 11,036 |
| Town of Vail | Western Slope / Mountains | 2,000 to 24,999 | 4,835 |
| Town of Red Cliff | Western Slope / Mountains | Less than 2,000 | 257 |
| Town of Gypsum | Western Slope / Mountains | 2,000 to 24,999 | 8,040 |
| Town of Calhan | Eastern Plains | Less than 2,000 | 762 |
| Town of Monument | Front Range | 2,000 to 24,999 | 10,399 |
| Town of Green Mountain Falls | Front Range | Less than 2,000 | 646 |
| Town of Elizabeth | Eastern Plains | Less than 2,000 | 1,675 |
| Town of Coal Creek | Front Range | Less than 2,000 | 364 |
| Town of Brookside | Front Range | Less than 2,000 | 236 |
| Town of Silt | Western Slope / Mountains | 2,000 to 24,999 | 3,536 |
| City of Rifle | Western Slope / Mountains | 2,000 to 24,999 | 10,437 |
| City of Black Hawk | Front Range | Less than 2,000 | 127 |
| Town of Grand Lake | Western Slope / Mountains | Less than 2,000 | 410 |
| Town of Winter Park | Western Slope / Mountains | Less than 2,000 | 1,033 |
| Town of Lake City | Western Slope / Mountains | Less than 2,000 | 432 |
| Town of La Veta | Front Range | Less than 2,000 | 862 |
| Town of Walden | Western Slope / Mountains | Less than 2,000 | 606 |
| Town of Lakeside | Front Range | Less than 2,000 | 16 |
| City of Edgewater | Front Range | 2,000 to 24,999 | 5,005 |
| City of Lakewood | Front Range | 25,000 or more | 155,984 |
| Town of Flagler | Eastern Plains | Less than 2,000 | 567 |
| Town of Ignacio | Western Slope / Mountains | Less than 2,000 | 852 |
| Town of Bayfield | Western Slope / Mountains | 2,000 to 24,999 | 2,838 |
| City of Durango | Western Slope / Mountains | 2,000 to 24,999 | 19,071 |
| City of Fort Collins | Front Range | 25,000 or more | 169,810 |
| Town of Wellington | Front Range | 2,000 to 24,999 | 11,047 |
| City of Loveland | Front Range | 25,000 or more | 76,378 |
| Town of Timnath | Front Range | 2,000 to 24,999 | 6,487 |
| Town of Berthoud | Front Range | 2,000 to 24,999 | 10,332 |
| Town of Arriba | Eastern Plains | Less than 2,000 | 202 |
| Town of Iliff | Eastern Plains | Less than 2,000 | 246 |
| City of Fruita | Western Slope / Mountains | 2,000 to 24,999 | 13,395 |
| City of Grand Junction | Western Slope / Mountains | 25,000 or more | 65,560 |
| City of Craig | Western Slope / Mountains | 2,000 to 24,999 | 9,060 |
| Town of Dolores | Western Slope / Mountains | Less than 2,000 | 885 |
| City of Cortez | Western Slope / Mountains | 2,000 to 24,999 | 8,766 |
| Town of Nucla | Western Slope / Mountains | Less than 2,000 | 585 |
| City of Brush | Eastern Plains | 2,000 to 24,999 | 5,339 |
| Town of Wiggins | Eastern Plains | Less than 2,000 | 1,401 |
| Town of Log Lane Village | Eastern Plains | Less than 2,000 | 913 |
| City of Rocky Ford | Eastern Plains | 2,000 to 24,999 | 3,876 |
| Town of Fairplay | Western Slope / Mountains | Less than 2,000 | 724 |
| Town of Alma | Western Slope / Mountains | Less than 2,000 | 296 |
| Town of Haxtun | Eastern Plains | Less than 2,000 | 981 |
| City of Aspen | Western Slope / Mountains | 2,000 to 24,999 | 7,004 |
| Town of Wiley | Eastern Plains | Less than 2,000 | 437 |
| City of Lamar | Eastern Plains | 2,000 to 24,999 | 7,687 |
| Town of Rye | Front Range | Less than 2,000 | 206 |
| Town of Meeker | Western Slope / Mountains | 2,000 to 24,999 | 2,374 |
| City of Monte Vista | Western Slope / Mountains | 2,000 to 24,999 | 4,247 |
| Town of Yampa | Western Slope / Mountains | Less than 2,000 | 399 |
| City of Steamboat Springs | Western Slope / Mountains | 2,000 to 24,999 | 13,224 |
| Town of Hayden | Western Slope / Mountains | Less than 2,000 | 1,941 |
| Town of Moffat | Western Slope / Mountains | Less than 2,000 | 108 |
| Town of Crestone | Western Slope / Mountains | Less than 2,000 | 141 |
| Town of Mountain Village | Western Slope / Mountains | Less than 2,000 | 1,264 |
| Town of Ophir | Western Slope / Mountains | Less than 2,000 | 197 |
| Town of Telluride | Western Slope / Mountains | 2,000 to 24,999 | 2,607 |
| Town of Sedgwick | Eastern Plains | Less than 2,000 | 172 |
| Town of Breckenridge | Western Slope / Mountains | 2,000 to 24,999 | 5,078 |
| Town of Frisco | Western Slope / Mountains | 2,000 to 24,999 | 2,913 |
| Town of Keystone | Western Slope / Mountains | Less than 2,000 | 1,369 |
| City of Victor | Front Range | Less than 2,000 | 379 |
| City of Woodland Park | Front Range | 2,000 to 24,999 | 7,920 |
| Town of Akron | Eastern Plains | Less than 2,000 | 1,757 |
| City of Fort Lupton | Front Range | 2,000 to 24,999 | 7,955 |
| Town of Nunn | Front Range | Less than 2,000 | 504 |
| Town of Pierce | Front Range | Less than 2,000 | 1,097 |
| Town of Mead | Front Range | 2,000 to 24,999 | 4,781 |
| City of Dacono | Front Range | 2,000 to 24,999 | 6,297 |
| Town of La Salle | Front Range | 2,000 to 24,999 | 2,359 |
| Town of Kersey | Front Range | Less than 2,000 | 1,495 |
| Town of Severance | Front Range | 2,000 to 24,999 | 7,683 |
| Town of Erie | Front Range | 25,000 or more | 30,038 |
| Town of Johnstown | Front Range | 2,000 to 24,999 | 17,303 |
| Town of Windsor | Front Range | 25,000 or more | 32,716 |